As a manager, it is of the utmost importance to know how much value you are getting from Kimoby. You may be asking yourself—how much time are we saving with automations? How many videos are we sending to customers each week?
We want to give you more information on what’s going on in your account, give you tips on what needs improvement, and help you monitor key metrics so that you can take action.
Quick links
Setting up the Weekly Progress Report
Setting up the Weekly Progress Report
The weekly progress report is sent by email each week. You can choose to activate or deactivate it by following these steps:
- Click on your profile icon at the top-right.
- Click on Your Settings.
- From the list on the left, click on Notifications.
- Scroll down to the Reports section.
- Select ON
to receive the emails or OFF
to stop receiving them.
Breakdown of the Metrics
The report is broken down into six segments for your convenience: Communication, efficiency, customer experience, top performers, how you compare to others in your industry, and all time.
Communication:
This section shows you how much your staff is using Kimoby to communicate with customers, as well as the percentage of increase or decrease from the previous week.
- Messages sent: How many total messages were sent in the past week.
- Customers: How many customers have been served through Kimoby in the past week. This is calculated based on unique customers each week. If one customer has multiple visits in one week, it only counts as one customer.

Efficiency
This section shows you how Kimoby can help you save time by automating your daily tasks and facilitating communication between your staff. It also shows the percentage of increase or decrease from the previous week.
- Estimated time saved: Number of minutes saved in the past week by serving customers through Kimoby, versus in-person or over the phone. This is calculated based on the number of customers served (approx. 5 minutes each), the number of automated messages sent (approx. 30 seconds each), and the number of payment requests sent (approx. 3 minutes each).
- Automated messages sent: How many messages were sent via automations in the past week.
- Internal Messages: How many internal messages were sent through the Collaboration feature that week. Click here to learn more about Collaboration.

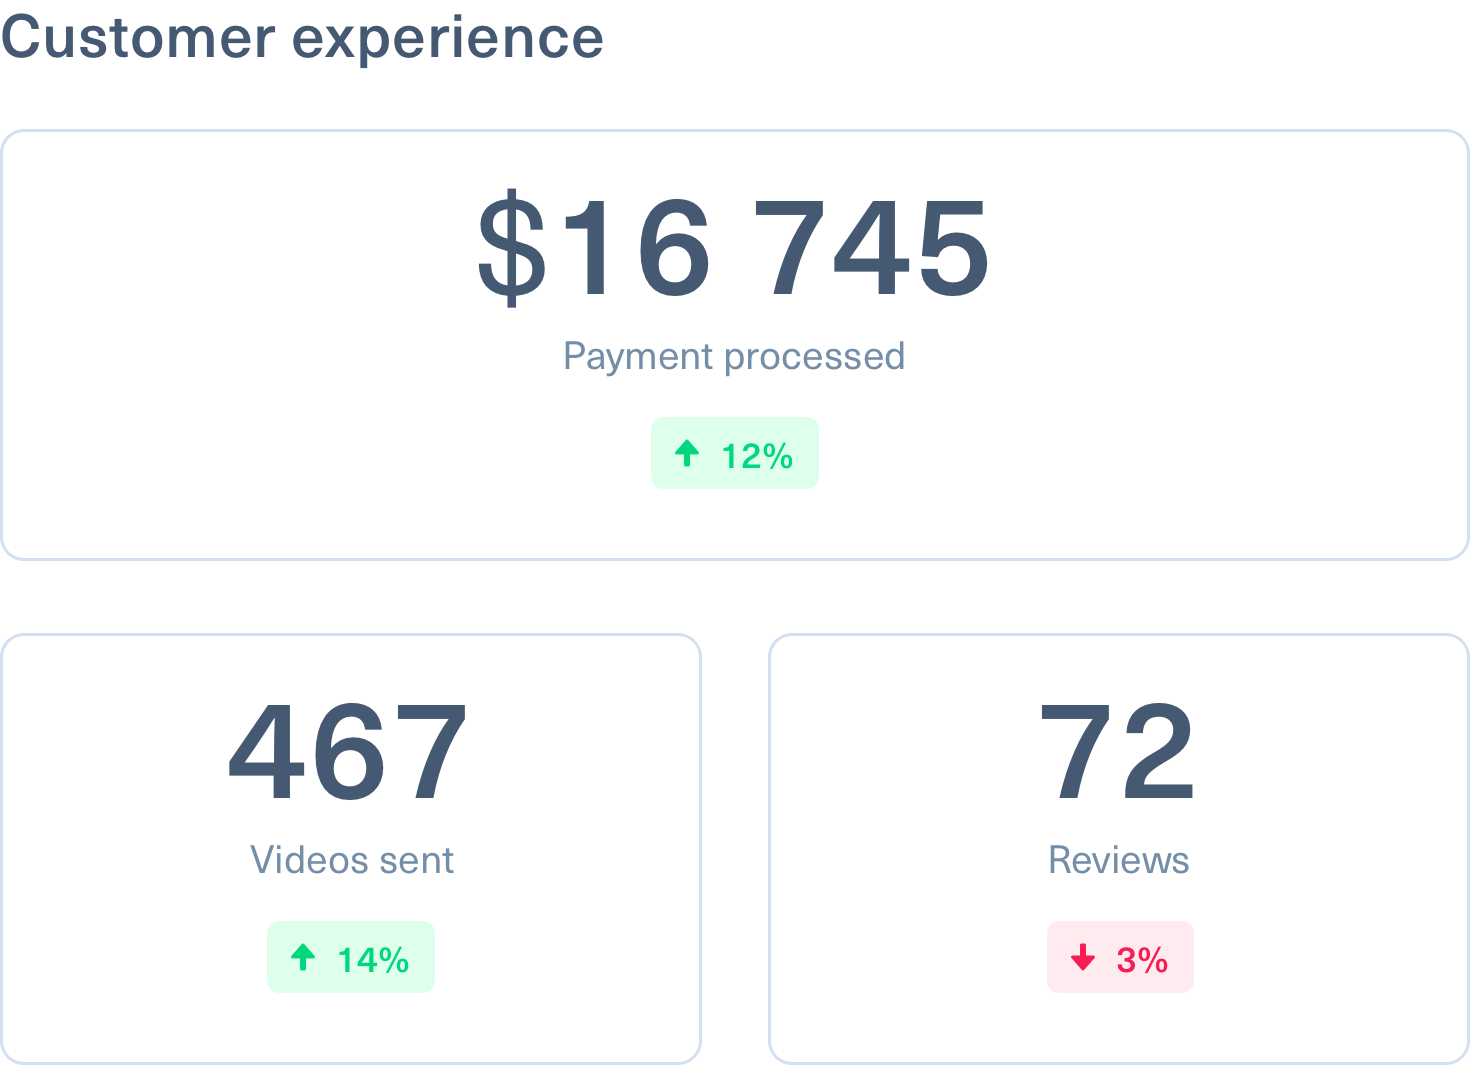
Customer Experience
This section shows metrics of features that have an important impact on the customer experience, such as walk-around videos and mobile payment requests. It also shows the percentage of increase or decrease from the previous week.
- Payments processed: The dollar amount of payments processed in the past week. This number is affected by any refunds processed that week.
- Videos sent: How many videos, such as walkarounds, were sent directly to customers or through a Collaboration space in the past week.
- Reviews: How many reviews were submitted by customers in the past week via the Reviews feature.
Top Performers
This section shows you the three users that have used Kimoby the most in the past week. This metric is based on messages sent to customers.

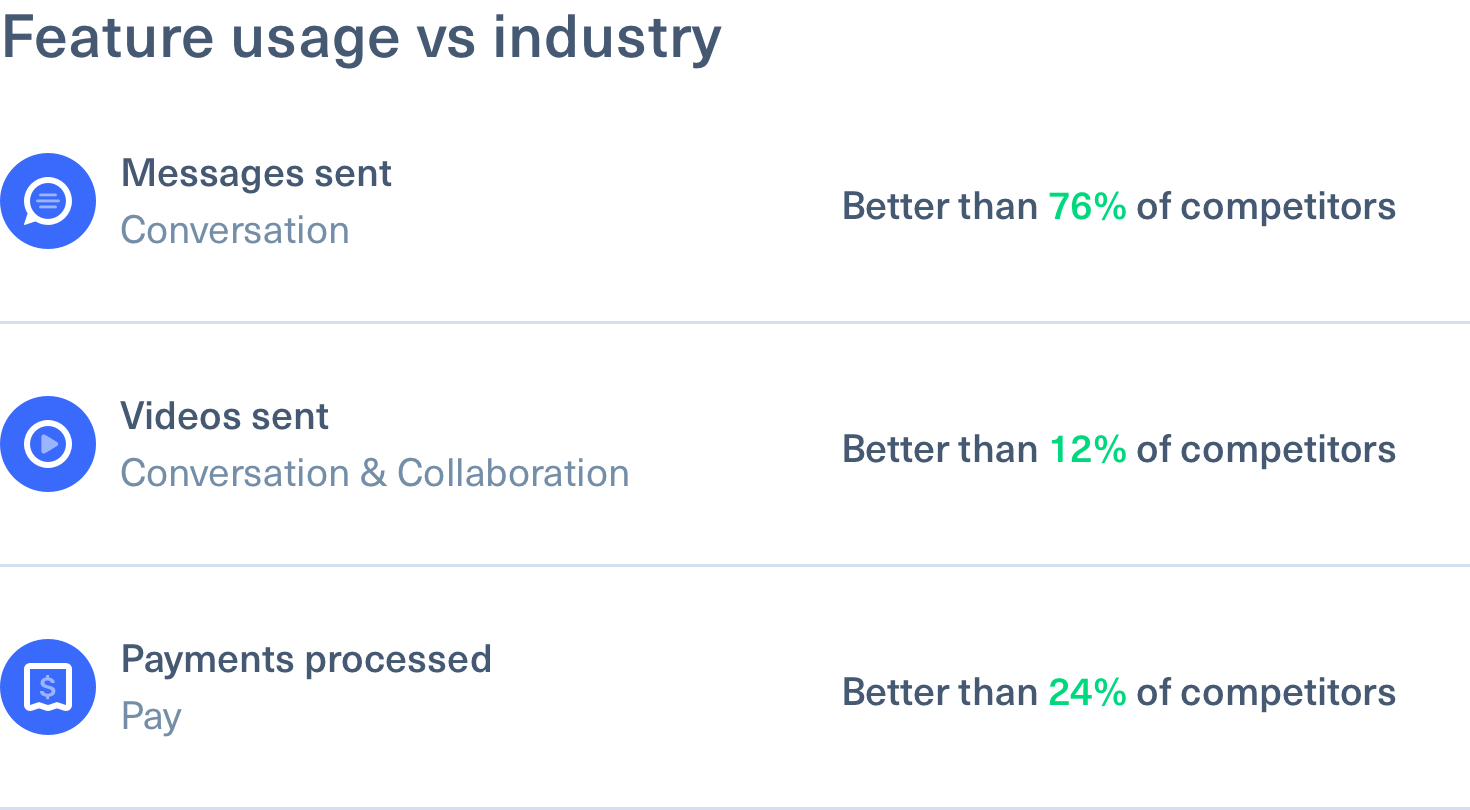
How you Compare to Others in your Industry
This section shows you how your usage of Kimoby stacks up against your competitors in the past week. This is calculated based on the usage of Kimoby by other customers in your industry.
- Messages sent: How the total number of messages sent to customers compares to your competitors.
- Videos sent: How the total number of videos sent to customers and through the Collaboration feature compares to your competitors.
- Payments processed: How the total number of payments processed (in dollars) compares to your competitors.
All Time
This section shows how much value you’ve gotten from Kimoby so far. It displays your lifetime totals for various metrics across the platform.
- Sent messages and automated messages: The cumulative total of all messages sent to customers, including automated messages.
- Sent photos and videos: The cumulative sum of all pictures and videos sent directly to customers or through the Collaboration feature.
- Total customers served: The cumulative sum of all customers served through Kimoby. This is based on how many unique customers receive a message through Kimoby each week.
- Sent messages internally: The cumulative sum of messages sent through the Collaboration feature, not including photos and videos.
- Payments processed online: The cumulative sum of payments processed through Kimoby Pay shown in dollars.
