Understanding your performance metrics is an integral part of your business' success. By taking the time to analyze your results, you can make concrete plans for improving your performance.
If you have more than one account related to your email, you can view all of your metrics at once to manage the activity of each account, like changing the usage, and comparing results.
To access your multi-account metrics:
- Select your company's name at the top right corner of your screen.
- Select Go to Multi-Account Metrics.
You can choose to display the metrics for the period of your choice or select the specific dates you need.
You can always export your metrics by selecting Export metrics ![]() .
.
Quick Links
- Top Accounts
- Average Response Time
- Messages Sent
- Messages Received
- Videos Sent
- Images Sent
- Payment Requests Sent
- Average Kimoby Pay Volume
- Satisfaction Rating
- Cell Phones Added
- Appointment Reminders
- Unsubscribed Customers
Top Accounts

The first five companies that sent the most messages will be displayed at the top of your screen.
You can always click on See beyond top 5 to display all other companies related to your email if there are more.
Every company will be identified with a green arrow, a red arrow, or a dash. They will be ranked according to the number of messages sent in the previous period.
This means that, depending on the chosen period, you will see if a company has sent more or fewer messages compared to the others.
Average Response Time

This metric shows the average amount of time it took for a customer to get a reply from your staff, per company.
Short average response time indicates that staff is working fast and efficiently in providing answers to customer's requests for information.
Each company will have colour and you can click on the eye ![]() icon to hide or display the companies of your choice.
icon to hide or display the companies of your choice.
Also, by going over each colored dot in the graphic, you will have the detail of the average response time with the name of the company.
Messages Sent

This metric shows a graphic of the messages sent per company.
Each company will be color-coded. You can click on the eye ![]() icon to hide or display the companies of your choice.
icon to hide or display the companies of your choice.
Also, by going over each colored dot in the graphic, you will see the messages sent with the name of the company. If more than one company has sent the same number of messages, they will appear in the same bubble.
Messages Received

This metric shows a graph of the number of messages that you received from your customers per company.
Each company will be color-coded, and you can click on the eye ![]() icon to hide or display the companies of your choice. Also, by going over each colored dot in the graphic, you will see the number of messages received with the name of the company. If more than one company has the same number of received messages, they will appear in the same bubble.
icon to hide or display the companies of your choice. Also, by going over each colored dot in the graphic, you will see the number of messages received with the name of the company. If more than one company has the same number of received messages, they will appear in the same bubble.
Videos Sent
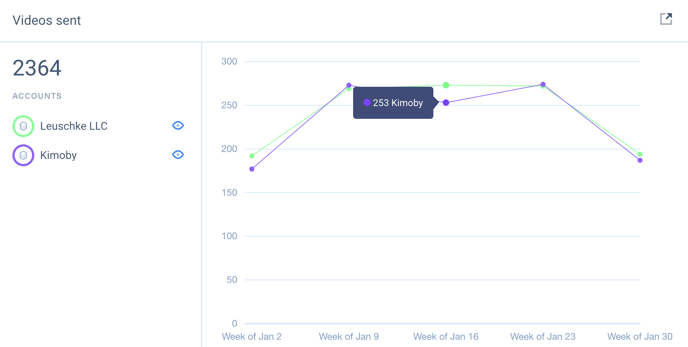
This metric displays the total number of videos sent per company according to the selected period, such as per day, week, or month.
Each company will be color-coded, and you can click on the eye ![]() icon to hide or display the companies of your choice. Also, by going over each colored dot in the graphic, you will see the number of videos sent with the name of the company. If more than one company has sent the same number of videos, they will appear in the same bubble.
icon to hide or display the companies of your choice. Also, by going over each colored dot in the graphic, you will see the number of videos sent with the name of the company. If more than one company has sent the same number of videos, they will appear in the same bubble.
Images Sent
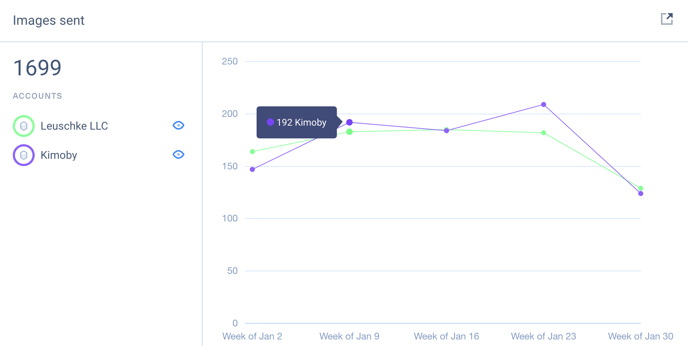
This metric displays the total number of images sent per company according to the selected period, such as per day, week, or month.
Each company will be color-coded, and you can click on the eye ![]() icon to hide or display the companies of your choice. Also, by going over each colored dot in the graphic, you will see the number of images sent with the name of the company. If more than one company has sent the same number of images, they will appear in the same bubble.
icon to hide or display the companies of your choice. Also, by going over each colored dot in the graphic, you will see the number of images sent with the name of the company. If more than one company has sent the same number of images, they will appear in the same bubble.
Payment Requests Sent
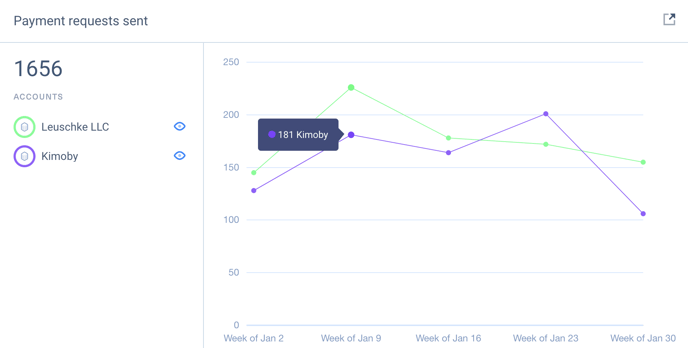
This metric displays the total number of payment requests sent per company according to the selected period, such as per day, week, or month.
Each company will be color-coded, and you can click on the eye ![]() icon to hide or display the companies of your choice. Also, by going over each colored dot in the graphic, you will see the number of payment requests sent with the name of the company. If more than one company has sent the same number of payment requests, they will appear in the same bubble.
icon to hide or display the companies of your choice. Also, by going over each colored dot in the graphic, you will see the number of payment requests sent with the name of the company. If more than one company has sent the same number of payment requests, they will appear in the same bubble.
Average Kimoby Pay Volume

This metric shows the total volume and payment requests that went through Kimoby Pay.
By going over each dot in the graphic, you can view the total amount processed through Kimoby Pay according to the time range selected at the top of the Metrics section.
Satisfaction Rating

For all messages you send automatically, such as post-appointment feedback requests, the system automatically sorts customer replies into positive and negative sentiments to help you spot service issues and prioritize follow-ups.
The metric shows the total number of positive customer comments compared to the total number of negative customer comments, per company, for all automated messages that customers respond to.
Each company will be color-coded, and you can click on the eye ![]() icon to hide or display the companies of your choice. By hovering your cursor over the graphic, you will see the number of positive reviews (displayed in the green zone) or negative reviews (displayed in the red zone).
icon to hide or display the companies of your choice. By hovering your cursor over the graphic, you will see the number of positive reviews (displayed in the green zone) or negative reviews (displayed in the red zone).
Cell Phones Added

This metric shows the total amount of cell phone numbers recorded in your contact database, per company.
Each company will be color-coded and you can click on the eye ![]() icon to hide or display the companies of your choice. Also, by going over each colored dot in the graphic, you will see the number of cell phone numbers added with the name of the company. If more than one company has added the same number of cell phones, they will be displayed in the same bubble.
icon to hide or display the companies of your choice. Also, by going over each colored dot in the graphic, you will see the number of cell phone numbers added with the name of the company. If more than one company has added the same number of cell phones, they will be displayed in the same bubble.
Appointment Reminders

This metric shows the total number of appointment reminders sent to customers and the number of times customers confirmed their appointment with a reply containing the word YES or cancelled their appointment with a reply containing the word NO.
Each company will be color-coded and you can click on the eye ![]() icon to hide or display the companies of your choice. By hovering your cursor over the graphic, you will see the number of confirmed appointments (displayed in the green zone) or cancellations (displayed in the red zone).
icon to hide or display the companies of your choice. By hovering your cursor over the graphic, you will see the number of confirmed appointments (displayed in the green zone) or cancellations (displayed in the red zone).
Unsubscribed Customers

This metric shows the total number of unsubscribed customers per company.
Each company will be color-coded and you can click on the eye ![]() icon to hide or display the companies of your choice. By hovering your cursor over the graphic, you will see the number of unsubscribed customers per date range.
icon to hide or display the companies of your choice. By hovering your cursor over the graphic, you will see the number of unsubscribed customers per date range.